The energy yield assessment is a fundamental requirement for any new wind or solar project, with both developers and lenders spending considerable time with their respective advisers to understand the underlying wind or solar regime. The remainder of this article speaks predominantly to wind energy yield assessment, but the same principles can be applied to solar projects.
Before we start, a short discussion around P50 and P90: The P50 energy yield estimate is the estimate of the energy yield which the energy yield modeller estimates will be exceeded with a 50% probability. Similarly, the P90 energy yield estimate is the estimate of the energy yield which the energy yield modeller estimates will be exceeded with a 90% probability. Consequently, the P90 estimate is lower than the P50 estimate. Although P-levels are usually quoted as annualised figures, the application periods can differ: Hence you may see reference to a 1-year P90 or a 10-year P90. This is simply the estimate of the amount of energy which the modeller estimates will be exceeded in a 1-year period or a 10-year period (multiplied by 10, since it is an annualised figure). They differ because the P90 is a function of the median energy yield estimate and the standard deviation of the energy yield estimate. In the case of the 10-year P90, the uncertainty associated with the estimate is spread over 10 years, so that a bad year can be offset by a good year within the period; or statistically speaking, a larger sample size reduces the variance associated with the estimate. As an aside, because the P50 is simply the median of the probability distribution and takes no account of variance, there would be no difference between the 1-year and 10-year P50 estimates. A P90 estimate is typically used for the banker’s base case model, and a P50 for the equity case. Project financiers should consider whether the P90 estimate is a 1-year of 10-year figure in determining their cover ratios – particularly if the numbers are tight.
The process of estimating the energy yield for a wind farm involves the following steps:
- Implementation of an on-site wind data measurement campaign
- Estimation of the average long-term wind speed at the site
- Estimation of the energy yield (which is driven by the characteristics of the particular wind turbine selected for a wind farm)
- Uncertainty analysis (further consideration of the uncertainties associated with the particular yield estimation, e.g. short data record representing a long-term wind regime, accuracy of measurement equipment, etc.)
Given the significant number of wind projects implemented over the last 30 years globally, the process of estimating the energy yield for a wind farm is nowadays well understood, with established internationally accepted norms and standards. The above four steps are described in more detail below.
Measurement Campaign
Wind projects require on-site measurement campaigns in order generate an energy yield for a potential wind farm. Data is collected using a wind mast and anemometers. Ideally the mast should be at turbine hub height to eliminate uncertainty associated with wind shear (vertical movement of air) and uncertainty associated with different wind speeds at different heights.
Typically one or more wind masts are placed within circa two kilometres of the furthest proposed turbine locations in the future wind farm. Each mast will have a number of cup anemometers (a device for measuring wind speed) at intervals up the mast up to the hub height of the proposed turbines, as well as wind vanes for measuring wind direction, thermometers and possibly barometers for measuring air pressure.
The period over which data should be collected should be greater than one year in order to assess the effects of seasonality on the wind resource. Any additional period in excess of one year is beneficial in that it further reduces the standard deviation of the data sample and allows some or better identification of long-term trends. For this reason, nearby meteorological station data is often correlated with the data derived from the on-site mast and, should the correlation be sufficiently high, used to establish whether wind speeds experienced in the 12-month measurement period are above or below the long-term average.
The topography of the site, and in particular the extent of rough terrain and surfaces such as mountainous terrain, trees, tall buildings and other wind turbines effect the flow of air across the site. In a relatively low-complexity (smooth, few trees or other such features) site, industry experts recommend that measurement masts are placed within one to two kilometers of the turbines.
Data is collected at short intervals, such as every 10 minutes. Before further analysis, the data is usually checked and cleaned for any anomalies (e.g. periods where equipment has failed).
Estimation of Long-Term Wind Speed
The collected data is used to fit a Weibull probability distribution function, which represents the statistical distribution of the wind speed. A normal distribution is sometimes used as a tractable approximation to the Weibull function.
If there is a nearby meteorological station with wind measurement data which is sufficiently highly correlated with the on-site data, its data may be used to determine long-term trends in the on-site wind data. For example, it may be possible to determine whether the measured year is abnormally windy or still. If such long-term information is not available (which is the case in most instances), then this is addressed in the uncertainty analysis (see below), i.e. the standard deviation of the energy yield estimate is increased, resulting in a lower P90 estimate.
Once the long-term average wind speed for a mast location has been derived, the wind speed is in turn estimated for each future turbine location, which will then enable an estimation of the overall energy yield for the wind farm, discussed further below.
Energy Yield Estimation
For each turbine location, the wind distribution is transformed using either a theoretical or empirical power curve associated with the proposed wind turbine, thereby converting the wind speed distribution into an energy output distribution. The power curve is provided by the turbine manufacturer, and it is noteworthy that the turbine manufacturer will typically provide a power output guarantee supported by performance damages, with the result that the power curves are unlikely to be unduly optimistic. An example of a power curve is displayed below:
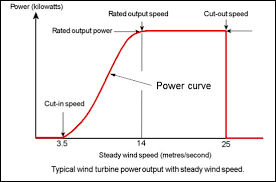

(Source: www.wind-power-program.com)
In addition to fitting the probability distribution function for wind speed, the data is used to determine the extent of turbulence (very short duration gusting), changes in wind direction and wind shear (vertical air movement), all of which are incorporated into the yield estimation model for the power output.
While a measurement mast as described may accurately determine the output of a wind turbine on the same spot, wind speeds and other relevant meteorological conditions will change as turbines are sited further away from the measurement location. Consequently, the wind yield modeller will typically build a computational fluid dynamics model which takes account of the topography of the proposed site, including the wake effect of the turbines upon each other. The layout of the wind farm, or micro-siting, is determined by means of optimising the positioning of the turbines with respect to energy yield.
The energy yield modeller deals with additional influences upon the plant and uncertainty in the modelling variables by modifying the expected energy yield. An example of this taken from a wind energy yield report is shown below:

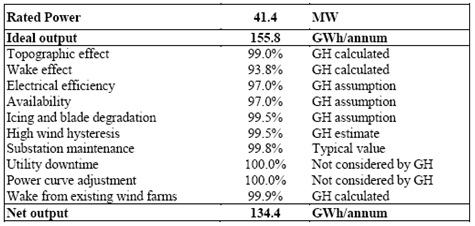
In this example, the modeller has decreased the expected energy yield, which is the central estimate, or the P50 energy yield. Going back to our discussion about probability distributions, the figure of 134.4 GWh/year is the modeller’s best estimate of the yield, and is therefore the median in the probability distribution.
To obtain the energy yield with a higher certainty (e.g. the P90 yield, or the yield that can be expected to be exceeded 90% of time) an uncertainty analysis is required which is discussed further below. Naturally, the P90 yield will be lower than the P50 yield. Regarding the losses calculated above, these particular loss factors attributed to the plant result in a certain loss (of 21.4GWh/annum in our example) but no change in volatility, and consequently reduce the P50 yield estimate and the P90 yield estimate by the same amount.
Uncertainty Analysis
There are a number of sources of uncertainty which feed into the standard deviation of the wind probability distribution function, thereby into the standard deviation of the energy yield probability distribution function, and which therefore decrease the P90 yield estimate, but not the P50 yield estimate. These sources of uncertainty are broadly split into two types, being:
- The underlying “true” volatility of the wind resource (it could actually blow more this year than next or vice versa); and
- The uncertainty associated with the calculations made along the way. Included here is the uncertainty introduced by using a short data record (e.g. 12 months’ on site data) , accuracy of the measurement equipment, etc.
Using this final power output probability distribution function, the energy modeller is able to determine confidence limits for the energy output of the plant. In particular:
- A P50 estimate is the median yield which is typically used for determining the equity case, and
- A P90 case, being the power output likely to be exceeded with a probability of 90%, is typically used as the power output assumption in the lenders’ base case.
Various P-values are used for debt structuring purposes, with the EU market commonly using a 10-year P90 yield, as alluded to above. The type of financing structure may also determine which P-value is used, e.g. higher gearing (80%+ debt) may need to be structured using a more conservative P-value. In South Africa, some projects have been structured using 1-year, and others 10-year P90 values. Ultimately, each project should be reviewed independently, by reviewing the underlying energy yield assessment (unique for each site) and conducting sensitivity analyses to assess how uncertainty in the energy yield impacts the expected financial performance of a project.
A little more on regional standards: The EU commonly uses a 10-year P90 with a minimum 1.30x DSCR, while the US market commonly uses a P99 with a minimum 1.0x DSCR. Please don’t take these as gospel, though. Rather assess your project and determine the suitability of any given regime (or use more than one!)
Comparing wind with solar projects, the variability in a wind energy resource assessment is typically higher than that in PV, and significantly higher than for CSP (concentrated solar thermal power). For example, the P50 yield typically exceeds the 1-year P90 yield in wind transactions by between 15% and 25% of the P90 yield. A Moody’s research paper for 34 wind farms in the USA provided an average P50/1-year P90 exceedence of 17.6%. This compares to a commensurate difference in PV of circa 8% – 10% (also using 1-year P90).
Breaking it down further, the size of the standard deviation of the energy yield estimate is a function of:
1) The estimated volatility of the wind regime; and
2) The uncertainty relating the model of the plant. I.e. How that wind regime translates into energy output.
The impact of the volatility of the wind regime can have a significantly different impact for different locations and different turbine choices. Consider the turbine power output curve:
In particular, for a given volatility of wind speed, a wind regime in which the median wind speed is close to the wind speed required to top out the power curve (14 m/s in the illustrated graph) will have a much power output volatility than that of a wind regime where the median wind speed is in the middle of the curve (circa 9 m/s). This is simply a function of the relative steepness of the curve at each of these two points – the steeper the curve, the greater the change in energy yield per m/s change in wind speed.
Consequently, although it is obvious that faster average wind speeds are better for a wind farm, there’s also a beneficial second-order effect in that they will probably also reduce the volatility of the energy yield.
It is important to keep in mind that the difference between the P90 and the P50 (for our discussion defined as “yield volatility”, which is not a formal industry term) does not influence the probability that the lenders’ base case will be achieved or exceeded – being, of course, 90%, assuming the competence of the modeller.